Dataset construction
Cleaned four public sources and built a balanced 26 class dataset from representative samples.
A 2025 computer vision study comparing segmentation quality, inference speed, and recognition errors in two lightweight YOLOv8 models.
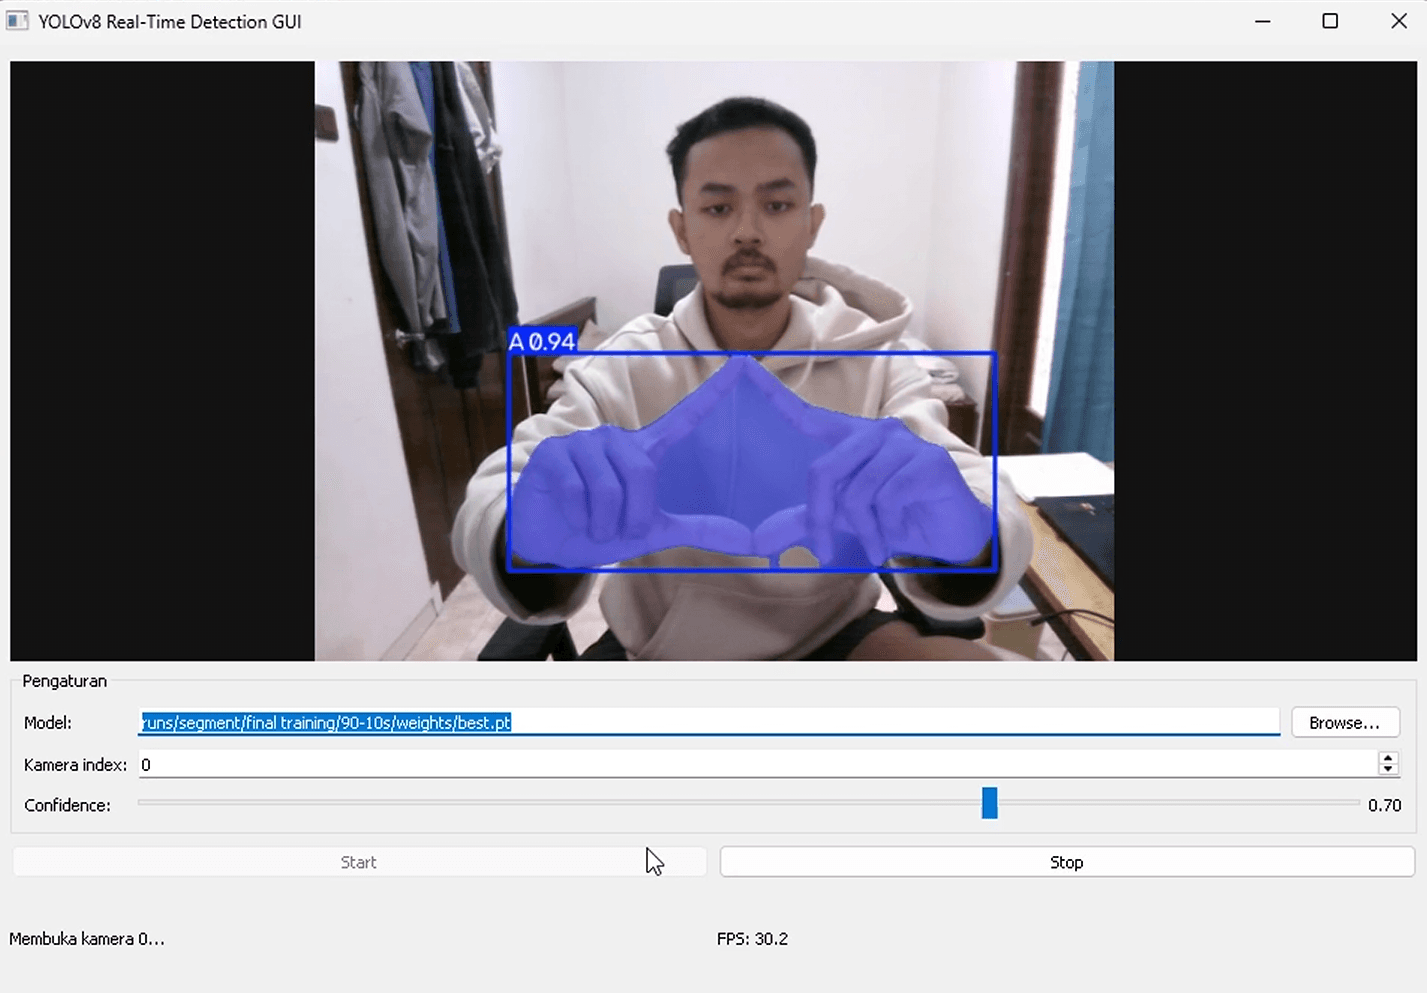
YOLOv8 BISINDO demo detecting the letter A from a live camera feed with a hand segmentation mask and 0.94 confidence
YOLOv8 segmentation across 26 BISINDO alphabet signs
This 2025 undergraduate thesis examined how two lightweight YOLOv8 segmentation models recognize and outline BISINDO alphabet signs. I trained YOLOv8n-seg and YOLOv8s-seg, then compared mask precision, recall, mAP, inference time, learning curves, and confusion matrices.
The dataset began with 4,526 images from four public Roboflow projects. I manually selected 10 images for each letter from every source, producing a balanced set of 1,040 images across 26 classes. I then replaced the original box annotations with polygon masks that follow the hand contour.
YOLOv8s-seg reached the highest mask mAP50-95 at 0.909, while YOLOv8n-seg reached 0.904 on the same 70:15:15 split and ran faster across all four experiments. Both models repeatedly confused the visually similar letters M and N when less training data was available.
The BISINDO alphabet includes signs that differ through small changes in finger position and hand shape. The reviewed BISINDO studies mainly located hands with rectangular boxes, which do not describe the gesture boundary at pixel level.
The research examined whether instance segmentation could detect all 26 letters while preserving the hand contour. It also tested whether the extra capacity of YOLOv8s-seg produced a meaningful gain over the faster YOLOv8n-seg model.
The experiment compares two segmentation variants and does not include a bounding box baseline. Its results describe the tradeoff between these two models rather than proving that segmentation outperforms object detection in every setting.
Several letters depend on subtle changes in finger position, orientation, and hand shape.
Backgrounds, camera angles, lighting, skin tones, and one or two handed signs all change the input.
I combined four public BISINDO datasets and manually reviewed 4,526 candidate images. From each source, I selected 10 images for every letter. The final dataset contains 1,040 images, with 40 images per class and an even balance between relatively plain and more complex backgrounds.
I created polygon masks for all selected images, prepared the data, trained both model variants under the same configuration, and tested four stratified train, validation, and test splits. I also analyzed learning curves and confusion matrices to understand how the models failed.
Cleaned four public sources and built a balanced 26 class dataset from representative samples.
Converted the selected images from box annotations to masks that follow the hand boundary.
Compared mask metrics, inference time, learning curves, and class confusion across four data splits.
The data pipeline starts with four public Roboflow sources. Manual selection keeps 10 images per class from each source, after which every chosen hand gesture receives a polygon mask. Images are oriented and resized to 640 x 640. Shear, brightness changes, and horizontal flips expand the training data.
Both models used 50 epochs, a batch size of 16, AdamW, and the same 640 x 640 input resolution on an NVIDIA RTX 3080. Each model was trained under 80:10:10, 70:15:15, 60:20:20, and 50:25:25 splits so their results could be compared under the same amount of training data.
Evaluation focused on segmentation masks through precision, recall, mAP50, and mAP50-95. Inference time measured speed, while learning curves and confusion matrices exposed convergence behavior and errors between individual letters.
Four public sources
4,526 candidate BISINDO images
Manual selection
10 images per class from every source
Balanced dataset
1,040 images across 26 classes
Polygon annotation
Hand contours drawn for every selected image
Preprocessing
Auto orientation and 640 x 640 resize
Augmentation
Shear, brightness, and horizontal flip
Four data splits
Training share reduced from 80% to 50%
Two YOLOv8 variants
YOLOv8n-seg and YOLOv8s-seg
Evaluation
Mask quality, speed, curves, and class errors
Every class receives 10 images from each source instead of inheriting the original class imbalance.
Both model variants use the same settings within each split scenario, keeping the comparison consistent.
1,040
cleaned images
selected from 4,526 public source images
26
BISINDO alphabet classes
40 selected images per class
0.909
best mask mAP50-95
YOLOv8s-seg on the 70:15:15 split
2.7–3.8 ms
YOLOv8n-seg inference
measured on an RTX 3080 across four splits
On the 70:15:15 split, YOLOv8s-seg reached 0.909 mask mAP50-95 and YOLOv8n-seg reached 0.904, an absolute difference of 0.005. Across all four splits, YOLOv8n-seg completed inference in 2.7 to 3.8 ms, compared with 4.3 to 4.7 ms for YOLOv8s-seg on the same RTX 3080 hardware.
The learning curves indicated steadier convergence and smaller training and validation loss gaps for YOLOv8s-seg. The confusion matrices also revealed a repeated weakness: both models mixed up M and N more often as the amount of training data decreased.
These measurements come from prepared test splits. The thesis did not evaluate continuous signing, live camera use, edge devices, words, sentences, or a production translation application.
The best shared split separated the two models by 0.005 mask mAP50-95.
YOLOv8n-seg was faster in every split scenario on the same training hardware.
The confusion matrices repeatedly exposed errors between the visually similar letters M and N.
The M and N errors became more visible with less training data. More model capacity did not remove the need for diverse examples of similar signs.
mAP50 looked strong across the experiments, but mAP50-95, inference time, learning curves, and confusion matrices exposed different weaknesses.
YOLOv8s-seg offered slightly stronger mask quality and steadier training, while YOLOv8n-seg offered faster inference. The right choice depends on the target hardware and latency budget.
Next project
A mobile nutrition prototype with a food model that recognizes 43 classes and reached 80% test accuracy.